
Once a model is built (see Model bricks and TOPIA I) and solved (see Solver backends and TOPIA II), a handful of utility functions do the rest of the day-to-day work: pull objects and results out, edit a piece and re-solve, organize scenarios on disk, and compare runs. This article tours that layer.
We use the packaged single-region TOPIA kit as a running example, and
keep every store — scenarios, models, repositories and the registry —
under a temporary folder. All four matter: save_scenario()
saves the model to the model store and references it, so redirecting
only the scenario path leaves a models/ folder beside the
article.
wf <- file.path(tempdir(), "wf")
set_scenarios_path(wf)                                  # where scenarios go
set_models_path(file.path(wf, "models"))                # ... and models
set_repositories_path(file.path(wf, "repositories"))    # ... and repositories
set_registry_file(file.path(wf, "energyRt_registry.csv"))

um  <- topia$modules$electricity$R1
mod <- newModel("TOPIA", data = um$repo,
                calendar = topia$modules$calendars$s4_h24,
                region   = um$regions,
                horizon  = topia$modules$horizons$base, discount = 0.05)
# interpolate + solve on the bundled GLPK; echo = FALSE keeps the log quiet
scen <- interpolate_model(mod, name = "BASE") |>
  solve_scenario(solver = solver_options$glpk, echo = FALSE)
Selecting objects: getObject()
getObject() returns the building-block objects
held in a repository, model or scenario, filtered by
class, name,
description, region or any object
slot. It is the object-level counterpart of getData()
(which returns their data). By default it returns a named list keyed by
object name; drop = TRUE unwraps a single match into the
object itself.
repo <- um$repo
names(getObject(repo, class = "technology"))        # all technologies
#> [1] "ECOA" "EGAS" "ENUC" "ESOL" "EWIN" "EHYD" "EBIO"
names(getObject(repo, class = "supply", region = "W1"))
#> [1] "SUP_COA" "SUP_BIO" "SUP_NUC" "RES_SOL" "RES_WIN"
getObject(repo, name = "ECOA", drop = TRUE)@invcost # the ECOA object itself
#>   vintage cluster region year invcost wacc payback eac retcost
#> 1    <NA>    <NA>   <NA>   NA    2000   NA      NA  NA      NA
Region matching reads @region slots and the
region/src/dst columns of any
data.frame slot, so it works for every class; region-agnostic objects
(e.g. commodities) match every region. getObject() accepts
a scenario too, so the same query works before or after
solving.
Extracting data: getData()
getData() pulls parameter and
variable data out of a scenario as tidy data.frames.
With merge = TRUE it returns one long frame (a named list
otherwise); every frame carries a scenario and a
name column.
getData(scen, "vObjective", merge = TRUE)$value      # total system cost, MEUR
#> [1] 18279.84

gen <- getData(scen, "vTechOut", comm = "ELC", merge = TRUE)
head(gen[, c("scenario", "tech", "region", "year", "timeslice", "value")], 4)
#> # A tibble: 4 × 6
#>   scenario tech  region  year timeslice  value
#>   <chr>    <chr> <chr>  <int> <chr>      <dbl>
#> 1 BASE     ECOA  W1      2020 WIN_h00   0.151
#> 2 BASE     ECOA  W1      2020 WIN_h01   0.0882
#> 3 BASE     ECOA  W1      2020 WIN_h02   0.0501
#> 4 BASE     ECOA  W1      2020 WIN_h03   0.0253
The ... accept set filters, exact
(comm = "ELC") or regex (comm_ = "^EL").
timeframe = c("lowest","highest","all") controls how
timeslice-indexed values are returned. Rename dimensions or recode
values on the way out with newNames = /
newValues = (or afterwards with renameSets() /
revalueSets()), and discover which parameters carry a given
set with findData():
names(findData(scen, setsNames_ = "tech"))           # parameters indexed by 'tech'
#>  [1] "pTechWeatherAf"     "pTechWeatherAfs"    "pTechWeatherAfc"
#>  [4] "pTechCap2act"       "pTechEac"           "pTechWacc"
#>  [7] "pTechPayback"       "pTechEmisComm"      "pTechOlife"
#> [10] "pTechFixom"         "pTechInvcost"       "pTechStock"
#> [13] "pTechStockNew"      "pTechStockSurv"     "pTechVarom"
#> [16] "pTechAf"            "pTechRampUp"        "pTechRampDown"
#> [19] "pTechAfs"           "pTechGinp2use"      "pTechCinp2ginp"
#> [22] "pTechUse2cact"      "pTechAct2AInp"      "pTechCap2AInp"
#> [25] "pTechAct2AOut"      "pTechCap2AOut"      "pTechNCap2AInp"
#> [28] "pTechNCap2AOut"     "pTechPho2AInp"      "pTechPho2AOut"
#> [31] "pTechRet2AInp"      "pTechRet2AOut"      "pTechCinp2AInp"
#> [34] "pTechCout2AInp"     "pTechCinp2AOut"     "pTechCout2AOut"
#> [37] "pTechCact2cout"     "pTechCinp2use"      "pTechCvarom"
#> [40] "pTechAvarom"        "pTechShare"         "pTechAfc"
#> [43] "pTechCap"           "pTechNewCap"        "pTechRet"
#> [46] "pTechRetCost"       "vTechAInp"          "vTechAOut"
#> [49] "vTechAct"           "vTechCap"           "vTechEac"
#> [52] "vTechFixom"         "vTechInp"           "vTechInv"
#> [55] "vTechNewCap"        "vTechOut"           "vTechRetCost"
#> [58] "vTechRetiredNewCap" "vTechRetiredStock"  "vTechPhaseOut"
#> [61] "vTechStockCap"      "vTechStockPhaseOut" "vTechVarom"
#> [64] "vTechEmsFuel"
find_in_model(mod, "ECOA") text-searches every object
slot for a value — handy for locating where a name is used.
Editing an object: update()
update() edits the slots of a single
model object (a technology, commodity, demand, …). It does
not operate on a whole model or scenario — you update
the object, put it back into the repository with
add(..., overwrite = TRUE), and re-interpolate/solve.
ECOA <- getObject(repo, name = "ECOA", drop = TRUE)
ECOA <- update(ECOA, invcost = data.frame(invcost = 2500))  # pricier coal capex
repo_hi <- add(repo, ECOA, overwrite = TRUE)                # swap it back in

mod_hi  <- newModel("TOPIA_HI", data = repo_hi,
                    calendar = topia$modules$calendars$s4_h24,
                    region = um$regions, horizon = topia$modules$horizons$base,
                    discount = 0.05)
(For an already-interpolated scenario,
update_parameter(scen, param, data) writes rows straight
into its parameter store.)
Scenario folders and structure
(The Scenario management article explains this layer in depth — stores, manifests, the registry, runs, and variants; this section is the quick tour.)
The scenarios directory is an option — read it with
get_scenarios_path(), set it with
set_scenarios_path() (default "scenarios/").
Each scenario gets its own folder, named automatically as
name-model-calendar-horizon (parts joined by dashes, which
valid names cannot contain; duplicate parts are dropped, so a scenario
and model sharing a name appear once):
get_scenarios_path()
#> [1] "C:\\Users\\admin\\AppData\\Local\\Temp\\Rtmp8i9b8k/wf"
basename(scen@path)
#> [1] "BASE-TOPIA-s4_h24-base"
Saving a scenario writes an Arrow-backed folder that
mirrors the scenario’s structure — a thin scen.RData shell,
a scenario.yml manifest, each large data slot as a dataset,
and one folder per solver run:
<scenarios-path>/<name-model-calendar-horizon>/
├── scenario.yml        # manifest: model ref/hash, calendar, horizon,
│                       #   `default:` — the default run (user-changeable)
├── scen.RData          # thinned S4 scenario shell
├── class · format · layout   # "scenario" · "parquet" · "3"
├── logfile.csv         # timestamped save log
├── model/data/<repo>/<object>/<slot>/   # model data (embedded scenarios only)
├── modInp/parameters/<param>/           # interpolated input parameters
└── runs/               # one folder per solve
    ├── glpk/           #   base-problem run, named by its solve label
    │   ├── run.yml     #     provenance: solver, cmdline, times, objective
    │   ├── input/      #     the exchange tables handed to the solver
    │   ├── output/     #     the solver's raw dump (read_solution() reads it)
    │   └── modOut/variables/<var>/      # the solved variables
    └── julia_highs/    #   another backend's run of the same problem
Beyond the per-scenario traces above, an optional operation
log records the sequence of a working session:
set_log_file("energyRt_log.csv") makes
interpolate_model(), solve_scenario() and
solve_myopic() append one line each (operation, object,
status, objective, duration), and read_log() returns the
sequence as a tibble. It is off by default.
Solving the same scenario with several backends (or option sets —
pass run = "<label>" to
solve_scenario()) keeps every run side by side;
scenario_runs(scen) lists them with status and objective,
and read_solution(scen, run = "<label>") switches the
active solution. A saved scenario references its model in the model
store rather than embedding a copy of it (see
?save_scenario, embed_model).
A scenario knows whether its data is in RAM or on disk via
isInMemory(); when on disk, the slots are empty and read
lazily from the folder on demand. Folders from older energyRt versions
are still readable and migrate in place with
upgrade_scenario_layout(path).
Saving and loading
save_scenario() spills the scenario to its folder and
returns the (now on-disk) object;
load_scenario(path, env = NULL) reads the shell back. Its
data stays on disk until requested — getData() reads it
lazily, or obj2mem() pulls the whole scenario back into
memory.
saved <- save_scenario(scen, verbose = FALSE)
ld    <- load_scenario(saved@path, env = NULL, verbose = FALSE)
A saved scenario is also reachable by its registered
name — load_scenario("BASE", env = NULL)
resolves it through the project registry, and the cached accessor
getScenario("BASE") is the everyday short form (see the
Scenario management article):
identical(getScenario("BASE")@name, ld@name)
#> [1] TRUE
basename(saved@path)                                 # the scenario folder
#> [1] "BASE-TOPIA-s4_h24-base"
isInMemory(saved)                                    # FALSE -- data is on disk
#> [1] FALSE
getData(ld, "vObjective", merge = TRUE)$value        # lazy read, no full load
#> [1] 18279.84
ld <- obj2mem(ld) # rehydrate fully into RAM
isInMemory(ld)
#> [1] TRUE
Every save_scenario() / save_model() /
save_repository() also records its object in the project
registry — a single CSV (default
energyRt_registry.csv at the project root, see
get_registry_file()) indexing saved models, repositories,
scenarios, and runs. Repositories shared by several models can be stored
once with save_repository() and referenced by each model
(save_model(embed_repos = )), just as scenarios can
reference a stored model. load_registry() reads it,
find_in_registry() filters it (by type, name, or model
hash), and refresh_registry() rebuilds it by rescanning the
scenarios/ and models/ stores — the on-disk
manifests are the source of truth, so the registry can always be
reconstructed.
Comparing scenarios
Layer a policy lever onto the base model to get a second scenario,
then pass a named list of scenarios to
getData() — the scenario column makes the
comparison a one-liner. (Scenarios already saved compare by
name alone: getData(c("BASE", "CO2CAP"), ...) loads them
from the registry on the fly.)
scen_cap <- interpolate_model(mod, "CO2CAP", um$CO2_CAP) |>   # add the CO2 cap lever
  solve_scenario(solver = solver_options$glpk, echo = FALSE)
emis <- getData(list(BASE = scen, CO2CAP = scen_cap), "vEmsFuelTot",
                comm = "CO2", merge = TRUE)

emis |>
  group_by(scenario, year) |> summarise(ktCO2 = sum(value), .groups = "drop") |>
  ggplot(aes(factor(year), ktCO2, fill = scenario)) +
  geom_col(position = "dodge") +
  labs(x = "year", title = "CO2 emissions by scenario") + theme_bw()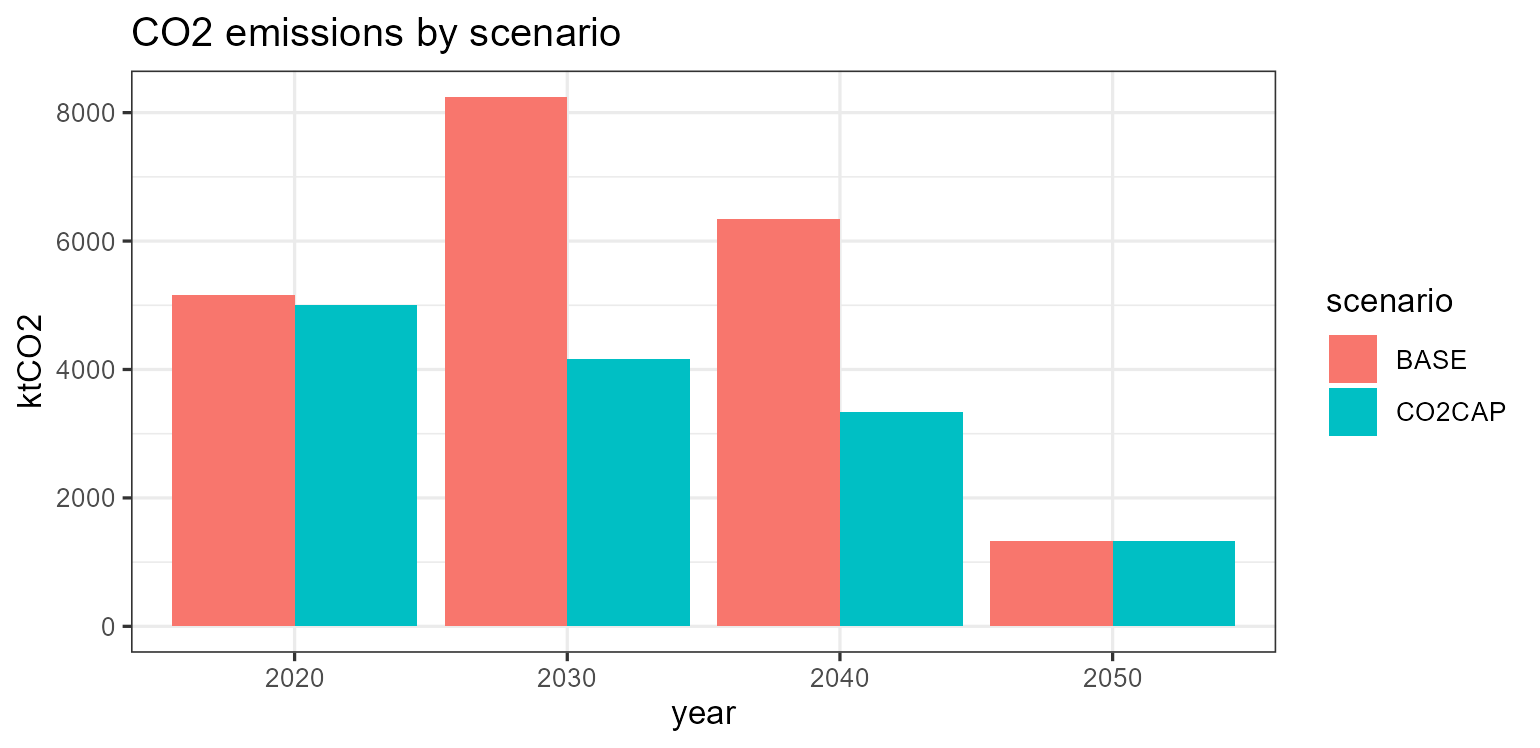
sapply(list(BASE = scen, CO2CAP = scen_cap),
       function(s) round(getData(s, "vObjective", merge = TRUE)$value[1]))
#>   BASE CO2CAP
#>  18280  23529
To reason about model size rather than results,
model_size() estimates the parameter/variable/constraint
counts of an interpolated scenario, and size() reports its
in-memory footprint:
model_size(scen)
#> model_size: BASE
#>   parameters : 179 value, 309 maps, 14 sets
#>   param rows : 6,715
#>   estimate   : ~16,298 variables, ~16,972 constraints (from gating maps)
#>   top parameters by rows:
#>     pTechCinp2use      1,536
#>     pTimesliceAgg      1,188
#>     pWeather           1,004
#>     pTimesliceWeight   404
#>     pDemand            384
#>     pExportRowPrice    384
#>     pExportRow         384
#>     pTechAf            384
#>     pStorageInpEff     384
#>     pStorageOutEff     384
#>     pTimesliceShare    101
#>     pTechFixom         24
#>     pTechInvcost       24
#>     pTechEac           20
#>     pTechStock         14
size(scen)
#> [1] "7.2 Mb"
For a systematic check that a build is correct and
efficient, compare_interp_settings(mod) and
compare_solve_settings(mod, solvers = ...) interpolate (and
solve) the model under different storage settings and tabulate build
size, time and — crucially — confirm the objective is invariant across
fold/sparse/prune. These run
several builds, so they are best run interactively:
compare_interp_settings(mod)                          # size/time by setting
compare_solve_settings(mod, solvers = list(solver_options$glpk))
Sampling: solving a subset of the model
Interpolation can solve a sample of a model without editing
the model itself — in time (a sampled calendar) and in space (a sampled
geoscale). Both work the same way: build the sample object, pass it to
interpolate_model(), and the scenario is declared,
validated and solved on the sample.
Sampled calendars
A sampled calendar is a row subset of the full calendar’s
timetable plus an explicit year_fraction — the
fraction of the year the sample covers. Timeslice weights annualise the
sample inside the solver (the top slice carries weight
1/year_fraction), so the objective is an estimate
of the full model’s — and exactly equals it when the sampled slices are
representative:
tt  <- topia$modules$calendars$s4_h24@timetable
tt2 <- tt[tt$SEASON %in% c("WIN", "SUM"), ]      # two of the four seasons
cal2 <- newCalendar(timetable = tt2, name = "s2h24",
                    year_fraction = sum(tt2$share))

scen_t <- interpolate_model(mod, "S2", cal2) |>
  solve_scenario(solver = solver_options$glpk, echo = FALSE)
sapply(list(full = scen, sampled = scen_t),
       function(s) round(getData(s, "vObjective", merge = TRUE)$value[1]))
#>    full sampled
#>   18280   20019
Two traps: pass year_fraction
explicitly (it is not recomputed from the subset), and
subset the existing timetable rather than rebuilding
one with make_timetable() (which would renormalise the
shares to a full year). Declarations are validated against the
model’s calendar, so objects naming out-of-sample timeslices
interpolate cleanly — their out-of-sample rows are simply filtered.
Spatial sampling
The spatial mirror: pass a filtered geoscale — a
geoscales::filter_geoscale() subset of the model’s regions
— and the scenario becomes a sub-territory model: only the
sampled regions are declared, out-of-sample parameter rows are filtered,
and trade routes crossing the sample boundary are dropped (with a
message). Unlike calendar sampling there is no
reweighting: regional quantities are extensive, so the
objective is the sub-territory’s own, and disjoint samples add
up to the full model (absent cross-boundary trade).
TOPIA is single-region, so a compact three-region demo:
library(geoscales)

r3 <- c("R1", "R2", "R3")
gs <- geoscale_from_leaftable(
  data.frame(zone = c("Z12", "Z12", "Z3"), region = r3, km2 = 1),
  geoframes = c("zone", "region"), name = "demo")

m3 <- newModel(
  "M3", region = r3, horizon = newHorizon(2020), discount = 0.05,
  repo = newRepository(
    "r",
    newCommodity("COA", timeframe = "ANNUAL"),
    newCommodity("ELC", timeframe = "ANNUAL"),
    newSupply("SUP_COA", commodity = "COA",
              supply = data.frame(region = r3, cost = 5)),
    newTechnology("ECOA", input = list(comm = "COA"),
                  output = list(comm = "ELC"),
                  af = data.frame(af.up = 0.9),
                  invcost = data.frame(invcost = 1000),
                  olife = list(olife = 30), cap2act = 1),
    newDemand("DEM_ELC", commodity = "ELC",
              demand = data.frame(region = r3, demand = c(10, 20, 30))),
    newTrade("TR23", commodity = "ELC", cap2act = 1,
             routes = data.frame(src = "R2", dst = "R3"),
             trade  = data.frame(src = "R2", dst = "R3", ava.up = 4),
             invcost = data.frame(invcost = 10))))
Filtering the geoscale to R1 + R2 and interpolating
drops the R2 -> R3 route on the way:
gs12 <- filter_geoscale(gs, "region", c("R1", "R2"),
                        drop_empty_geoframes = TRUE)
scen12 <- interpolate_model(m3, "S12", gs12)
#> spatial sample: kept 2 region(s); dropped 1 object(s) and 1 trade route(s) outside the sample (verbose = TRUE lists them)
as.character(scen12@settings@region)
#> [1] "R1" "R2"
A dropped route can optionally leave a priced boundary
stub at the kept endpoint — an export (kept source) or import
(kept destination) object bounded by cap.up (or, failing
that, the route’s ava.up) — via
boundary_prices; routes without a price row are just
dropped:
bp <- data.frame(src = "R2", dst = "R3", price = 50, cap.up = 4)
scen12p <- interpolate_model(m3, "S12P", gs12, boundary_prices = bp)
#> spatial sample: kept 2 region(s); dropped 1 object(s) and 1 trade route(s) outside the sample (verbose = TRUE lists them)
grep("^EXP", as.character(scen12p@modInp@sets$expp), value = TRUE)
#> [1] "EXP_TR23_R22R3"
The same surgery is available up front, as a model-to-model verb:
m12 <- subset_model_regions(m3, c("R1", "R2"), boundary_prices = bp)
as.character(m12@config@region)
#> [1] "R1" "R2"
The filtered geoscale records its coverage (fraction
of each weight’s parent total — see
geoscales::geoscale_coverage()), and its name is mangled
("demo[region:R1+R2]") so different samples of one parent
never collide in caches or joins. A pruned geoscale (a
coarser level of the model’s own hierarchy) requests a full-territory
solve at the parent level instead. That is a different operation – it
aggregates the model’s data rather than subsetting it – so
interpolate_model() refuses a pruned geoscale and points at
aggregate_model_regions(), which builds the coarser model
directly.
A trade window instead of a flat price
A stub priced with a single number is a perfectly elastic
counterparty: the region can buy or sell any amount the bound allows
without moving the price. For supply-curve work that is usually too
generous. boundary_window() builds a stepped
curve instead — a rising cost of imports, a falling revenue on
exports — and sizes its quantity from the region’s own demand:
bw <- boundary_window(m3, regions = c("R1", "R2"),
                      share = 0.1, nsteps = 3, price = 40)
head(bw, 2)
#>   src dst year timeslice price cap.up nsteps price_lo price_hi
#> 1  R2  R3   NA      <NA>    40      2      3       20       40
share = 0.1 caps the boundary at 10% of the region’s
demand in each timeslice, which is where the
import/export bound lives; summed over the year that is 10% of annual
demand. The window deliberately refuses to guess a price — it can size
the quantity from the model, but what the neighbours would charge is a
judgement, so price is required.
The result is an ordinary boundary_prices table with
three extra columns (nsteps, price_lo,
price_hi), so it goes where a flat one goes; omit them and
you get exactly the flat stub as before.
m12w <- subset_model_regions(m3, c("R1", "R2"), boundary_prices = bw)
stub <- m12w@data[["boundary_stubs"]]@data[[1]]
# `@cluster` declares WHAT the steps are; the split itself is enforced in the
# quantity bound, so read it there rather than from a descriptive copy
as.data.frame(stub@cluster)[, c("cluster", "desc", "order")]
#>   cluster                                         desc order
#> 1      S1 step 1 of 3: 0-0.3333 of quantity at 36.6667     1
#> 2      S2 step 2 of 3: 0.3333-0.6667 of quantity at 30     2
#> 3      S3 step 3 of 3: 0.6667-1 of quantity at 23.3333     3
Region by region
solve_by_region() runs the whole sweep — one region at a
time by default, or one group at a time — storing each as a variant of a
single scenario:
br <- solve_by_region(m3, name = "sweep")           # autarky
br <- solve_by_region(m3, name = "sweep_w",         # with a trade window
                      trade = "auto", price = 40, share = 0.1)
br$runs
getData(br, "vTechCap", merge = TRUE)               # stacked, region column
With trade = "none" the regions are disjoint and nothing
crosses, so the per-region objectives add up to the
full model’s — the same property the sample objectives have above. Any
trade window breaks it: each region then faces an exterior the others
cannot see. br$additive records which case you are in, and
print() says so rather than leaving it to be
discovered.
on_error = "continue" keeps the sweep going past a
region that fails to solve, which matters at 30-odd regions: a single
infeasible one should not cost you the rest.
Sampling the calendar repeatedly
A single sampled calendar gives one cheap estimate.
solve_by_sample() runs a whole ensemble of them —
consecutive blocks tiling the year, disjoint random draws, or bootstrap
draws — and keeps every run:
ens <- solve_by_sample(m3, name = "ens", sample_size = 2,
                       method = "sequential")     # two-season blocks
ens$runs
sample_summary(ens, "vTechCap", probs = c(0.05, 0.5, 0.95))
Samples are drawn as whole members of a calendar level — seasons,
weeks, days — because a calendar sample has to be a complete cross; a
ragged pick of individual timeslices is silently re-expanded by the
calendar constructor. calendar_samples() builds that
specification on its own if you want to look at it or edit it first.
Two rules follow from how a sampled calendar works, and both are
enforced rather than left to be discovered. A sample must keep
at least two members at every level: a single season
(or week, or day) collapses its level, and the only way to build such a
calendar renames the leaf timeslices so the model’s own data would stop
matching them. And every sample is annualised —
pTimesliceWeight = 1/year_fraction — so each one estimates
the whole year. The ensemble is therefore a set of replicates
whose spread is the sampling uncertainty; summing them is meaningless,
unlike the region sweep above, whose disjoint pieces do add up.
See also
- Model bricks and TOPIA I — building the objects and the model.
- Solver backends and TOPIA II — interpolating and solving.
-
?getData,?getObject,?update,?save_scenario,?load_scenario,?model_size,?compare_solve_settings,?subset_model_regions.