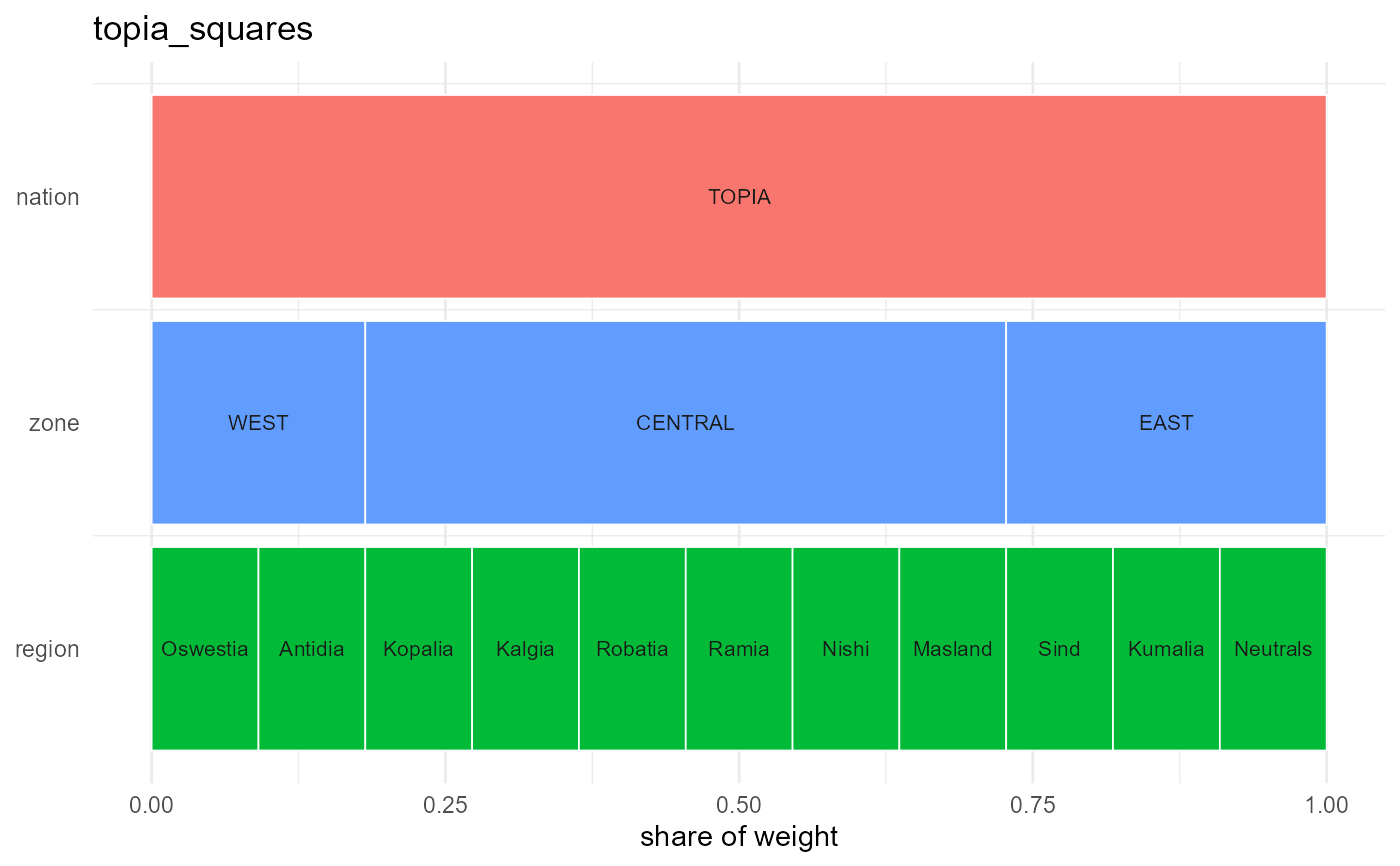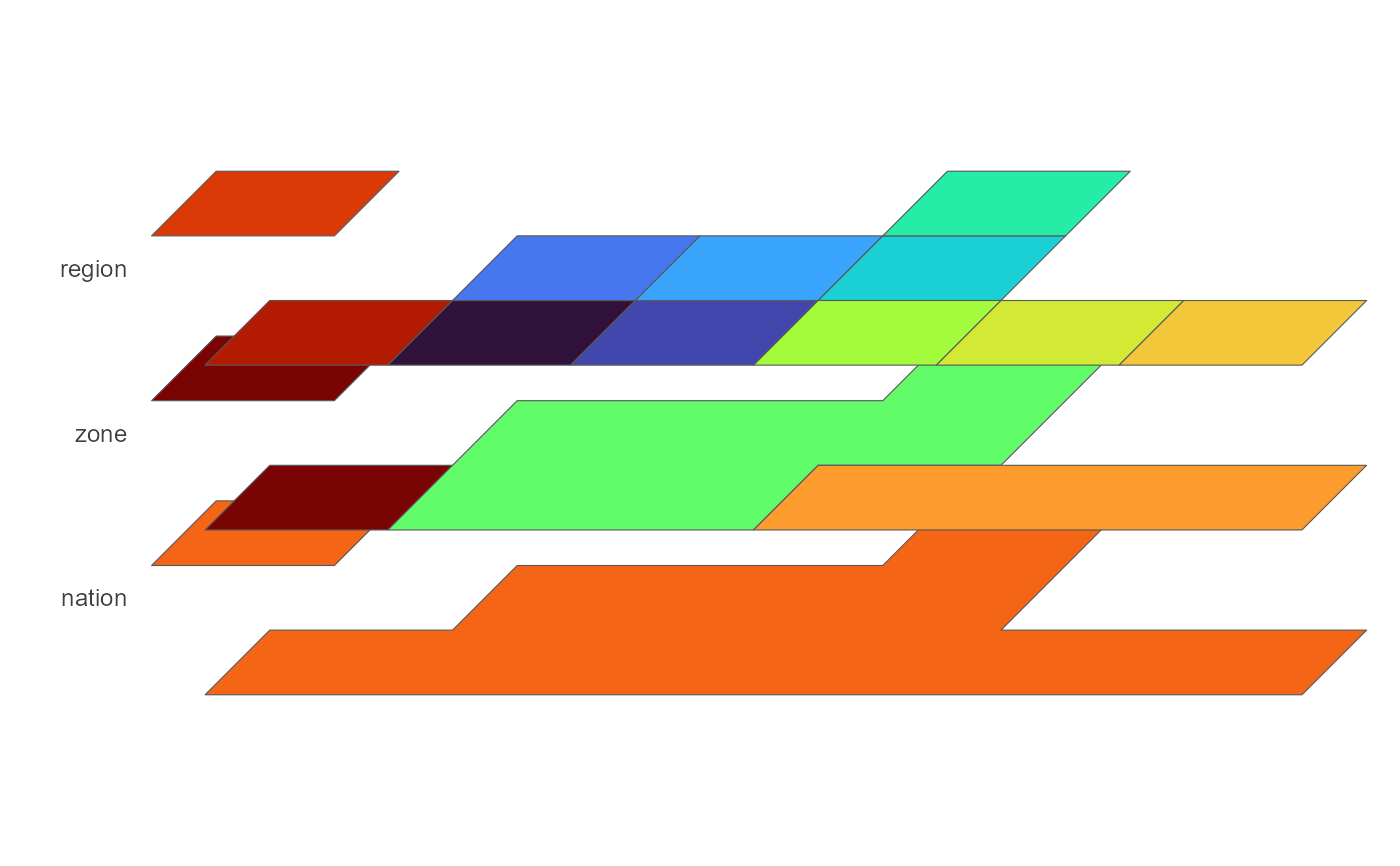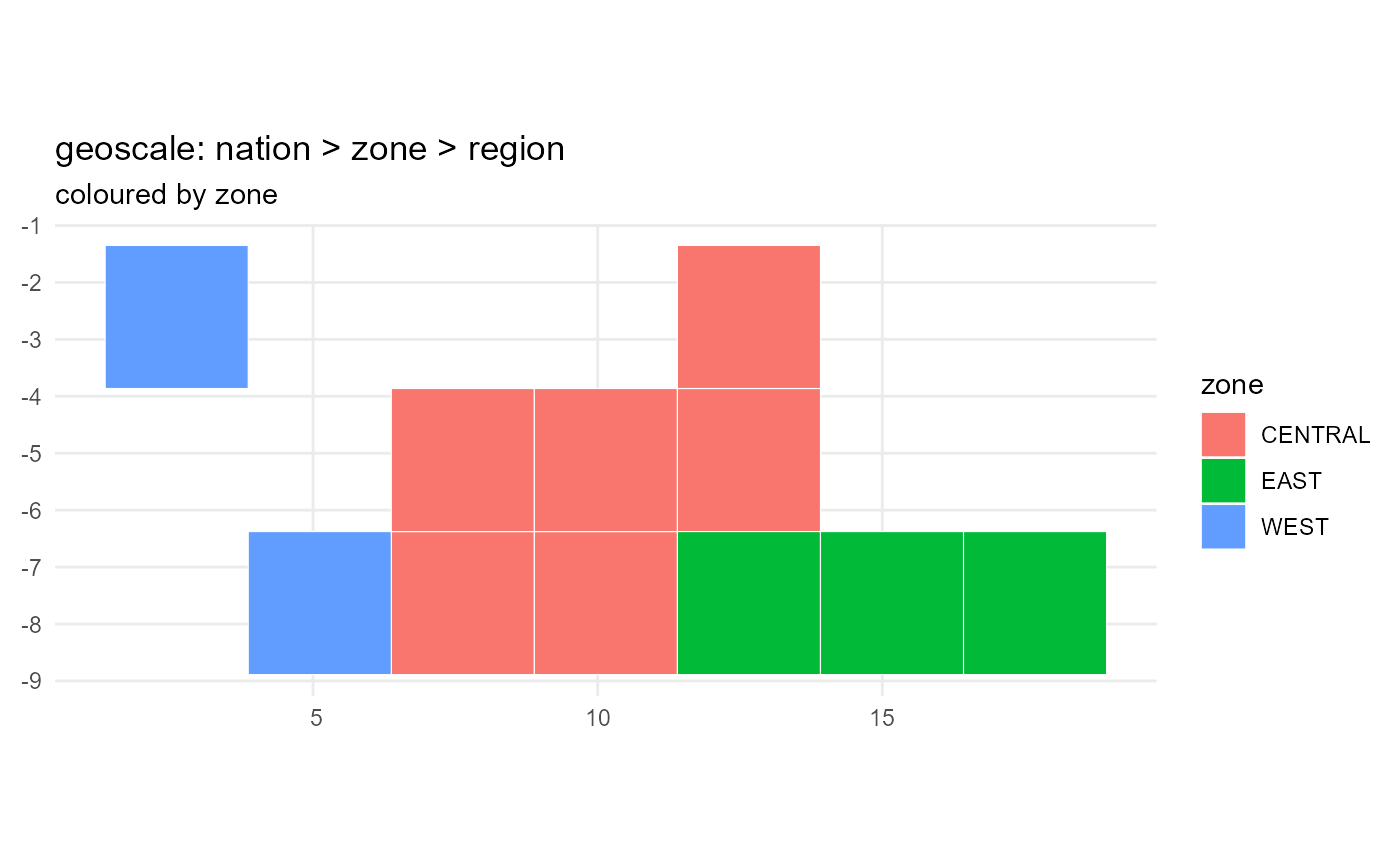
Visualises the geography attached to a model, scenario, config, or a bare
geoscales::GeoScale: a membership map of one geoframe ("map"), a
layered view of ALL geoframes stacked in a cabinet/perspective projection
with the coarsest level at the bottom ("stack"), or the geometry-free
"icicle" diagram.
Usage
plot_geoscale(
  object,
  type = c("map", "stack", "icicle"),
  geoframe = NULL,
  view = "cabinet",
  direction = "down",
  geoscale = NULL,
  ...
)
Arguments
- object
a
model,scenario,config, orgeoscales::GeoScale.- type
"map","stack", or"icicle".- geoframe
for
"map": the geoframe whose membership colours the atoms; default = the coarsest level above the atoms.- view
stack projection (
"cabinet","perspective", ... – seegeoscales::geoscale_autoplot()).- direction
"down"(default) draws the coarsest geoframe at the bottom of the stack;"up"at the top.- geoscale
a
geoscales::GeoScaleoverride, orNULLto resolve fromobject.- ...
passed to the geoscales plotting functions.
Details
"map" and "stack" need attached geometry (see
geoscales::attach_geometry_geoscale()) and the sf package; "icicle"
works without either and is the fallback the report templates degrade to.